Project 04 · Data Mining Capstone
Employee Attrition
A $3.5M turnover problem with one controllable lever. Three machine learning techniques, one consistent answer: overtime.
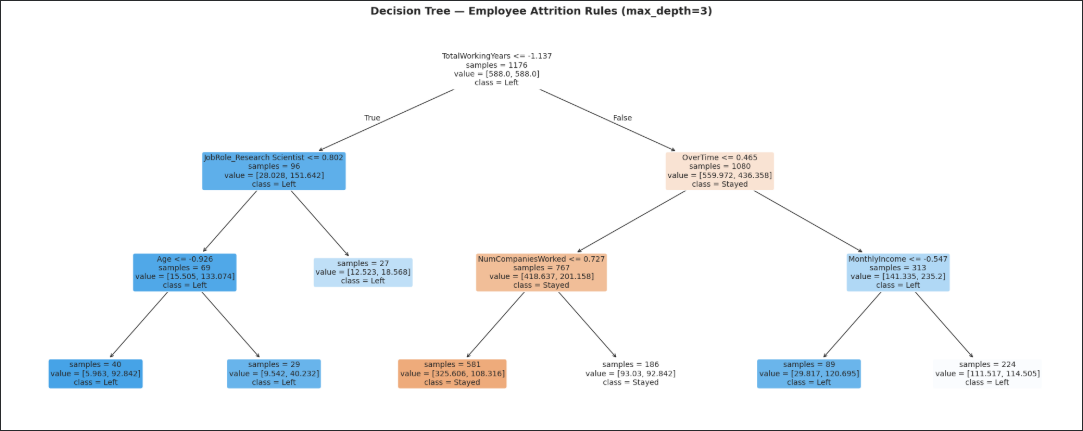
Tuned Decision Tree (max_depth=3). TotalWorkingYears splits first; OverTime drives the largest sub-branch (1,080 of 1,176 samples).
The Problem
Employee attrition is expensive. At an industry-estimated replacement cost of $15,000 to $25,000 per employee, a workforce of 1,470 with a 16% annual attrition rate translates to roughly $3.5M to $5.8M in turnover cost per year.
The question for HR leadership is not whether attrition is happening. It's whether attrition is predictable, concentrated, and preventable. This analysis uses the IBM HR Analytics dataset (1,470 employees, 35 features) to identify which employees are most at risk of leaving, what conditions drive their departures, and what management can actually do about it.
What I Built
I applied three machine learning techniques to the same dataset and asked whether they would point to the same conclusion. They did.
A tuned Logistic Regression model (77% accuracy, 0.80 ROC-AUC) ranked feature importance via coefficients. A tuned Decision Tree (73% accuracy, 0.71 ROC-AUC) produced plain-English classification rules a manager can act on. K-Means clustering (K=3) segmented employees into behavioral cohorts independent of the attrition label. All three identified the same dominant signal.
Then I translated the technical output into a business memo addressed to a fictional Chief Human Resources Officer, with three prioritized recommended actions and a quantified cost-of-inaction estimate. The technical work and the business communication are both in the repo.
Model Comparison
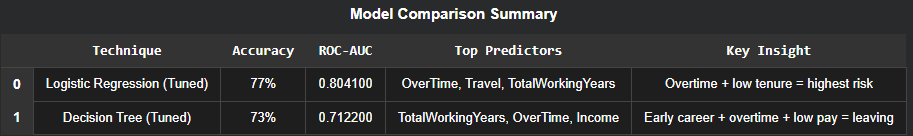
Both supervised models independently surface the same top predictors: Overtime and TotalWorkingYears.
Methodology
The dataset has a 16% positive class rate (employees who left). That class imbalance was handled in model training to keep the minority class from being ignored.
Logistic Regression hyperparameters were selected via cross-validated grid search over regularization strength and penalty type. The Decision Tree was tuned on max_depth via cross-validation to balance interpretability against overfitting. For K-Means, the cluster count was not assumed. K=3 was selected after evaluating both the Elbow Method and Silhouette Score.
The three techniques were chosen deliberately to span different modeling assumptions. Logistic Regression is parametric and probabilistic. Decision Trees are non-parametric and rule-based. K-Means is unsupervised and ignores the target variable entirely. If three methods this different all converge on the same finding, the finding is more credible than any single model could establish.
Choosing K for Clustering
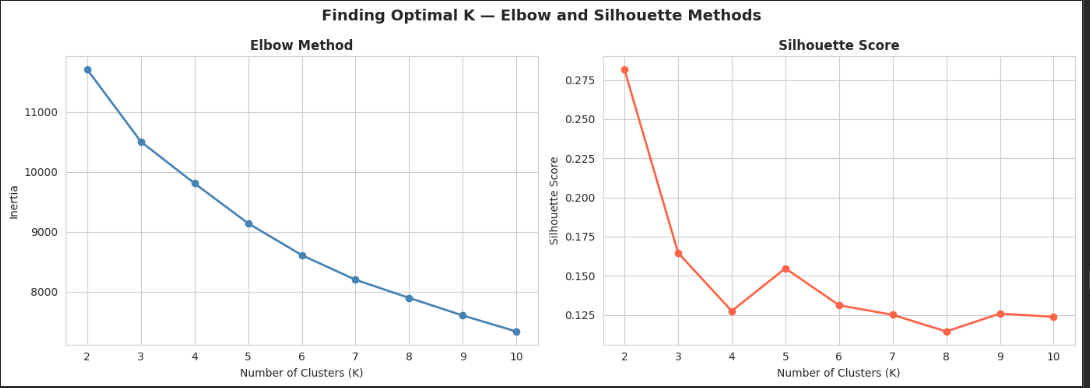
Elbow Method and Silhouette Score evaluated together. The cluster count was justified, not assumed.
Tech Stack
What I Learned
The most useful thing this project taught me is the gap between a model output and a business decision. The technical answer is "feature importance: OverTime." The business answer is something a manager can act on within 30 days. Closing that gap is not a modeling problem. It's a translation problem, and it's where most data science projects break down.
Running three techniques instead of one also taught me the value of triangulation. Any single model has assumptions baked into it that can produce a misleading result. When Logistic Regression, a Decision Tree, and an unsupervised K-Means clustering all surface overtime as the dominant pattern, that's not coincidence. It's the kind of finding I would actually stake a recommendation on. Running one model can produce a number. Running three can produce confidence.
Class imbalance was the most useful surprise. The dataset is 84% "stayed" and 16% "left." A model that simply predicts "stayed" for everyone would be 84% accurate and useless. Real-world ML problems are full of imbalances like this. Recognizing the imbalance and handling it correctly is most of the work. The accuracy number on its own is meaningless.
Next Project