Project 02 · EdTech
MathInsight AI
AI-driven instructional insights from Florida B.E.S.T. Progress Monitoring data. Built by a teacher, for teachers.
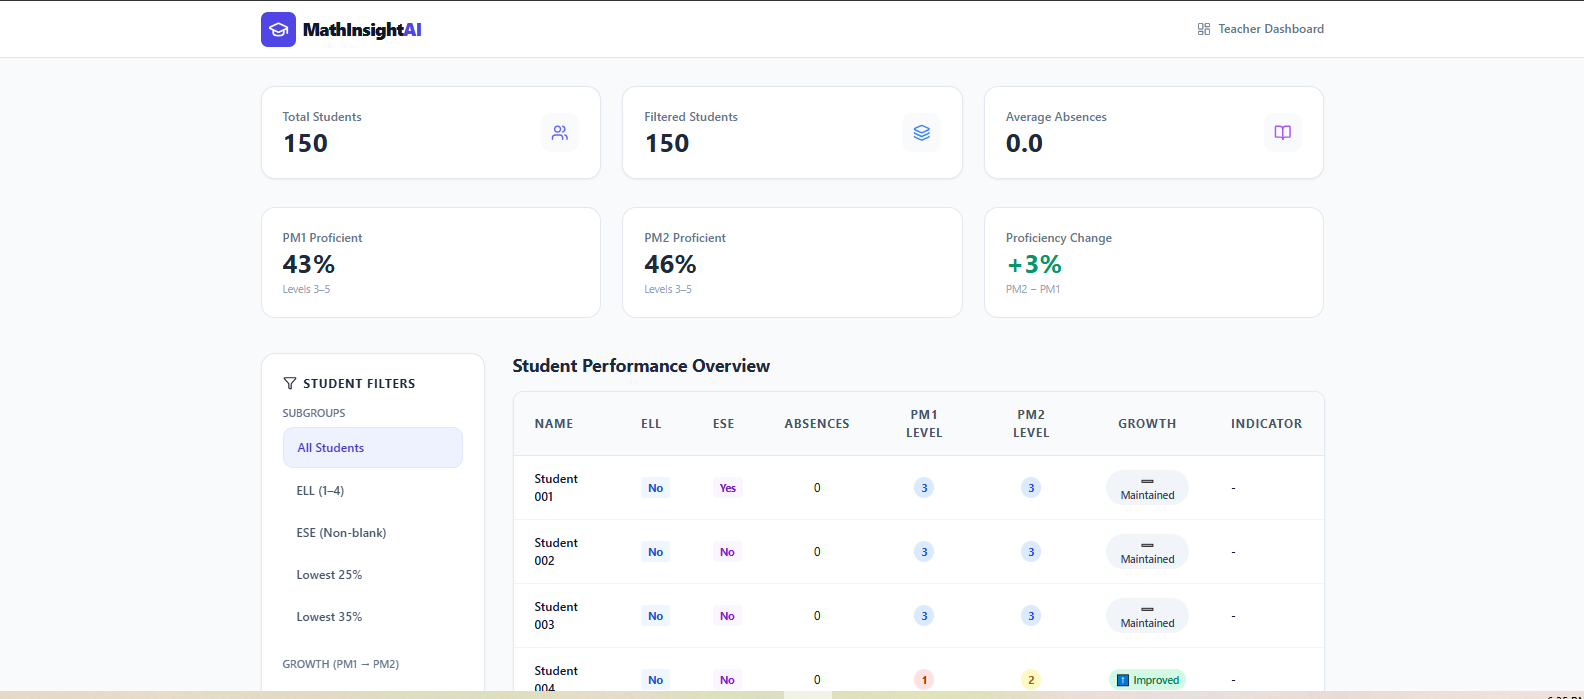
Teacher dashboard with KPI cards and subgroup filters (ELL, ESE, L25, L35).
The Problem
Florida students take three Progress Monitoring assessments each year: PM1, PM2, and PM3. PM3 is the final score. Once PM2 results come in, I have one window to figure out which students improved, which dropped, and where my Lowest 25% and Lowest 35% stand before they sit for PM3. Then I have to build instructional groups around what the data shows me. I do this analysis by hand in Excel for every student I teach.
The state reports tell me who passed PM2. They don't tell me which students need intervention now to score proficient on PM3. I built MathInsight because the work I was doing by hand after PM2 is the kind of work software should do in seconds.
What I Built
MathInsight takes a Florida B.E.S.T. PM export (CSV or XLSX) and produces three layers of output:
- Diagnostic. Proficiency rates for PM1 and PM2, the change between windows, regression flags with specific student IDs and score drops, and breakdowns by required state subgroups (ELL, ESE, L25, L35).
- Narrative. An AI-generated executive summary, growth trends analysis, and subgroup commentary, written in plain English.
- Action. AI-generated instructional groups that adapt to the dataset (the number of groups, their names, and their focus statements are tailored to what the data shows), each with student rosters and targeted strategy recommendations a teacher can use the next school day.
AI-Generated Summary and Regression Flags
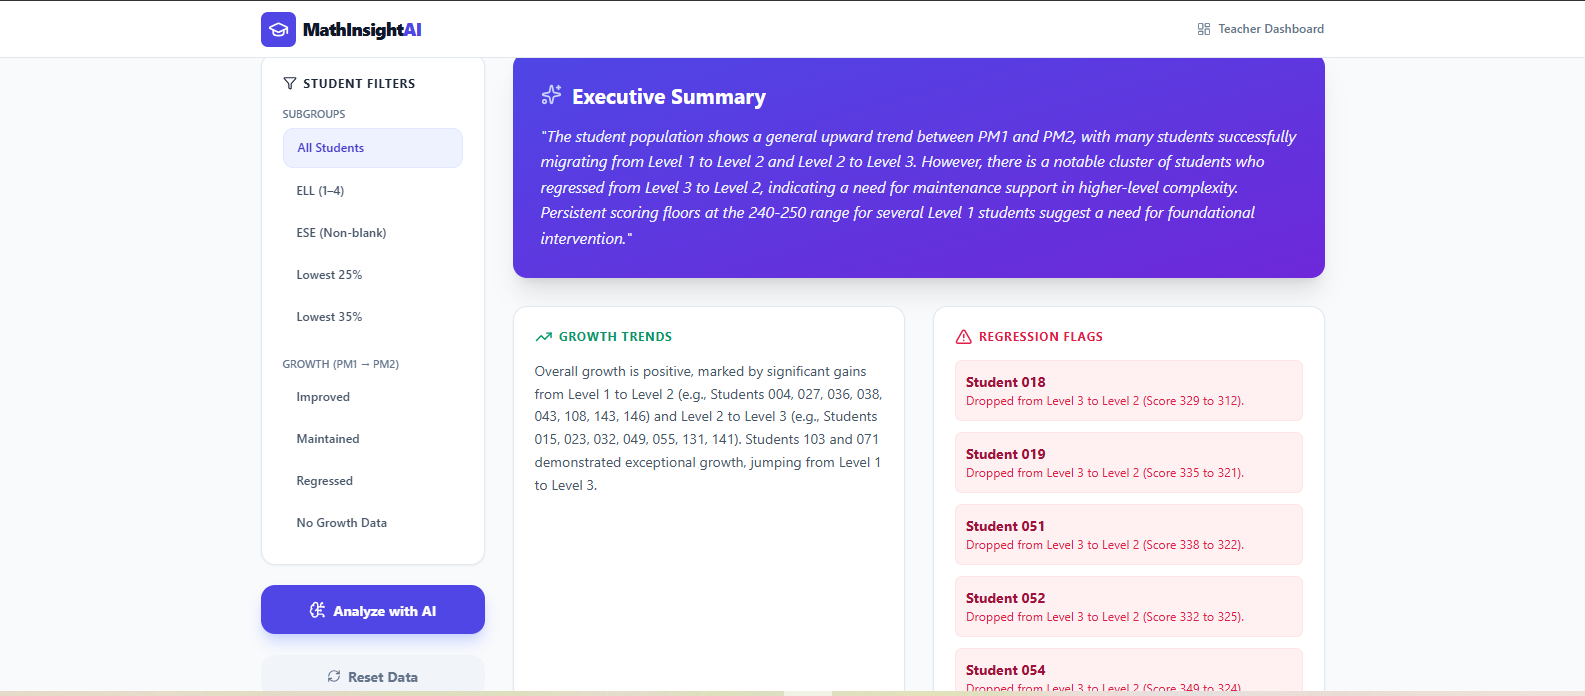
The AI output names specific students who regressed and quantifies the drop, surfacing the kids who would otherwise get lost in the average.
Instructional Groupings
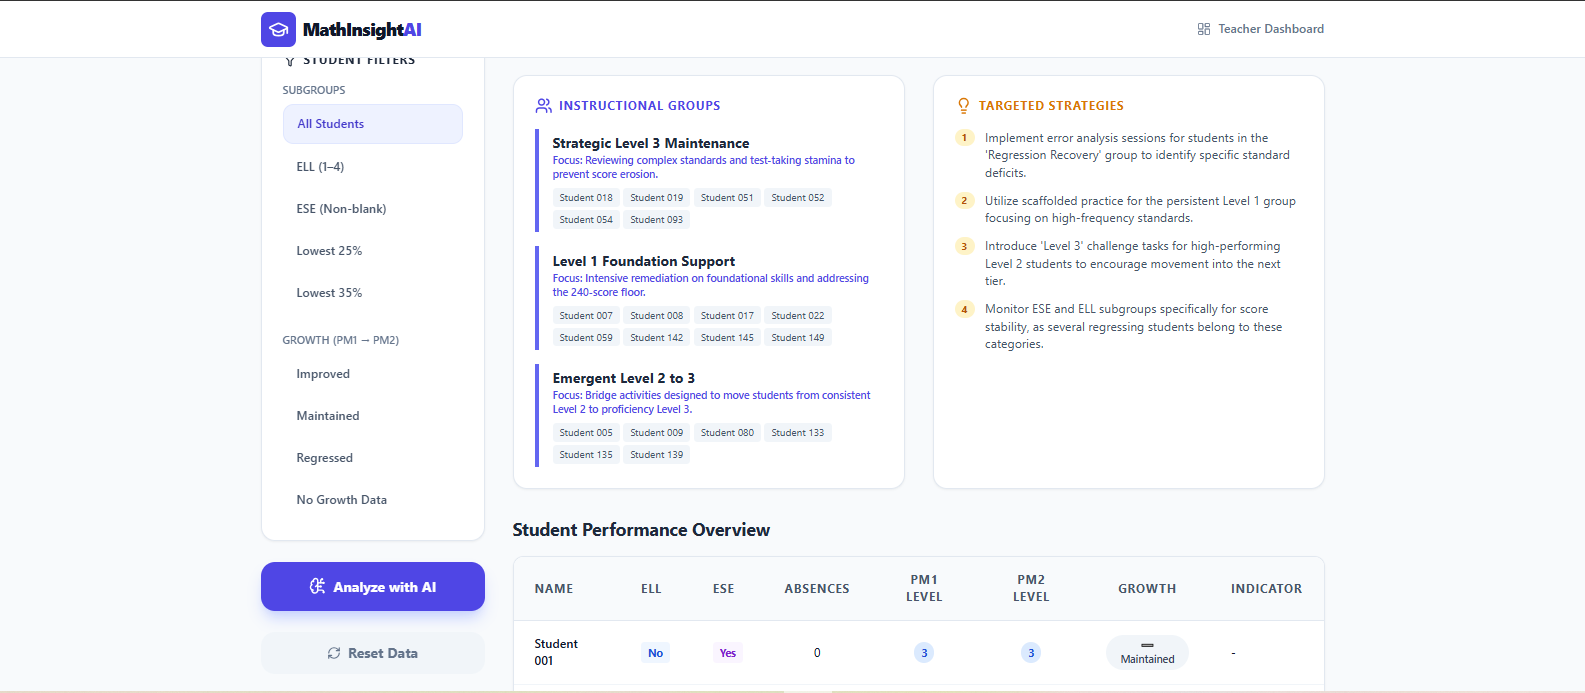
Gemini reads the filtered dataset and generates the instructional groups that make sense for it. The number of groups, their names, and their focus statements all adapt to what's actually in the data.
How It's Built
MathInsight was built in Google AI Studio Build mode. In that environment, the developer iterates with Gemini in natural language and the model generates a full-stack React + TypeScript + Node.js application. The work I did was the part the model couldn't do on its own: defining the data schema, structuring the prompt so the AI generates instructional groups that match real classroom triage, designing the subgroup filters to match Florida's required reporting categories, generating synthetic data that matches the structure of a real Florida B.E.S.T. PM export, and judging the AI output against fifteen years of classroom experience to know when it was wrong.
Uploaded data is held in browser memory only. It is never persisted to a database or sent anywhere except the Gemini API call that produces the analysis. The included dataset is synthetic, generated by a script that matches the column schema and statistical distributions (level percentages at each PM window) of a real Florida B.E.S.T. PM export. No actual student records are used. FERPA-compliant by design.
The app is deployed to Google Cloud Run. The Gemini API key lives on the backend; users can run the analysis without the key ever reaching the client.
Tech Stack
What I Learned
Gemini built me an app, but it didn't build me MathInsight. The first version got the structure mostly right, but it didn't understand what teachers actually do with the data. It read the column labels wrong. It didn't know that "Level 3 to 5" means proficient in Florida's framework. It tried to compare PM3 scores from last year against PM1 from this year, because it didn't know that progress monitoring resets each school year. It generated subgroup labels but had no idea what ELL or ESE meant, or that a blank in those columns was a valid value. I had to walk Gemini through how a math teacher reads a state assessment file before the output was useful.
The instructional groupings are the clearest example. Gemini's first attempt at categorizing students looked reasonable on paper but didn't match how teachers actually triage after a PM window. What worked was a prompt that doesn't lock in a fixed number of groups or fixed names. Instead, the AI reads the data and generates whatever groups make sense for it, anywhere from three to four, with focus statements tailored to what each group of students actually needs. The shape of the output adapts to the dataset, but the underlying triage logic stays put because I built it into the prompt. That's where 15 years of classroom experience showed up in the code. A non-teacher engineer wouldn't have known what triage logic to give the AI in the first place.
The other thing this project taught me is that EdTech has a privacy problem most other software doesn't. To develop the app safely, I wrote a script that generates synthetic students matching the column schema and the statistical distributions of a real Florida B.E.S.T. PM export, so the dataset behaves like real data without containing any. Combined with the fact that uploaded data is held in browser memory only and never persisted anywhere, the app is FERPA-compliant by design rather than as an afterthought. In K-12 software, that's not a feature, it's the architecture.
Next Project