Project 01 · Featured
SmartWrangle 2.0
An AI-powered data wrangling assistant. Upload any dataset and understand it instantly.
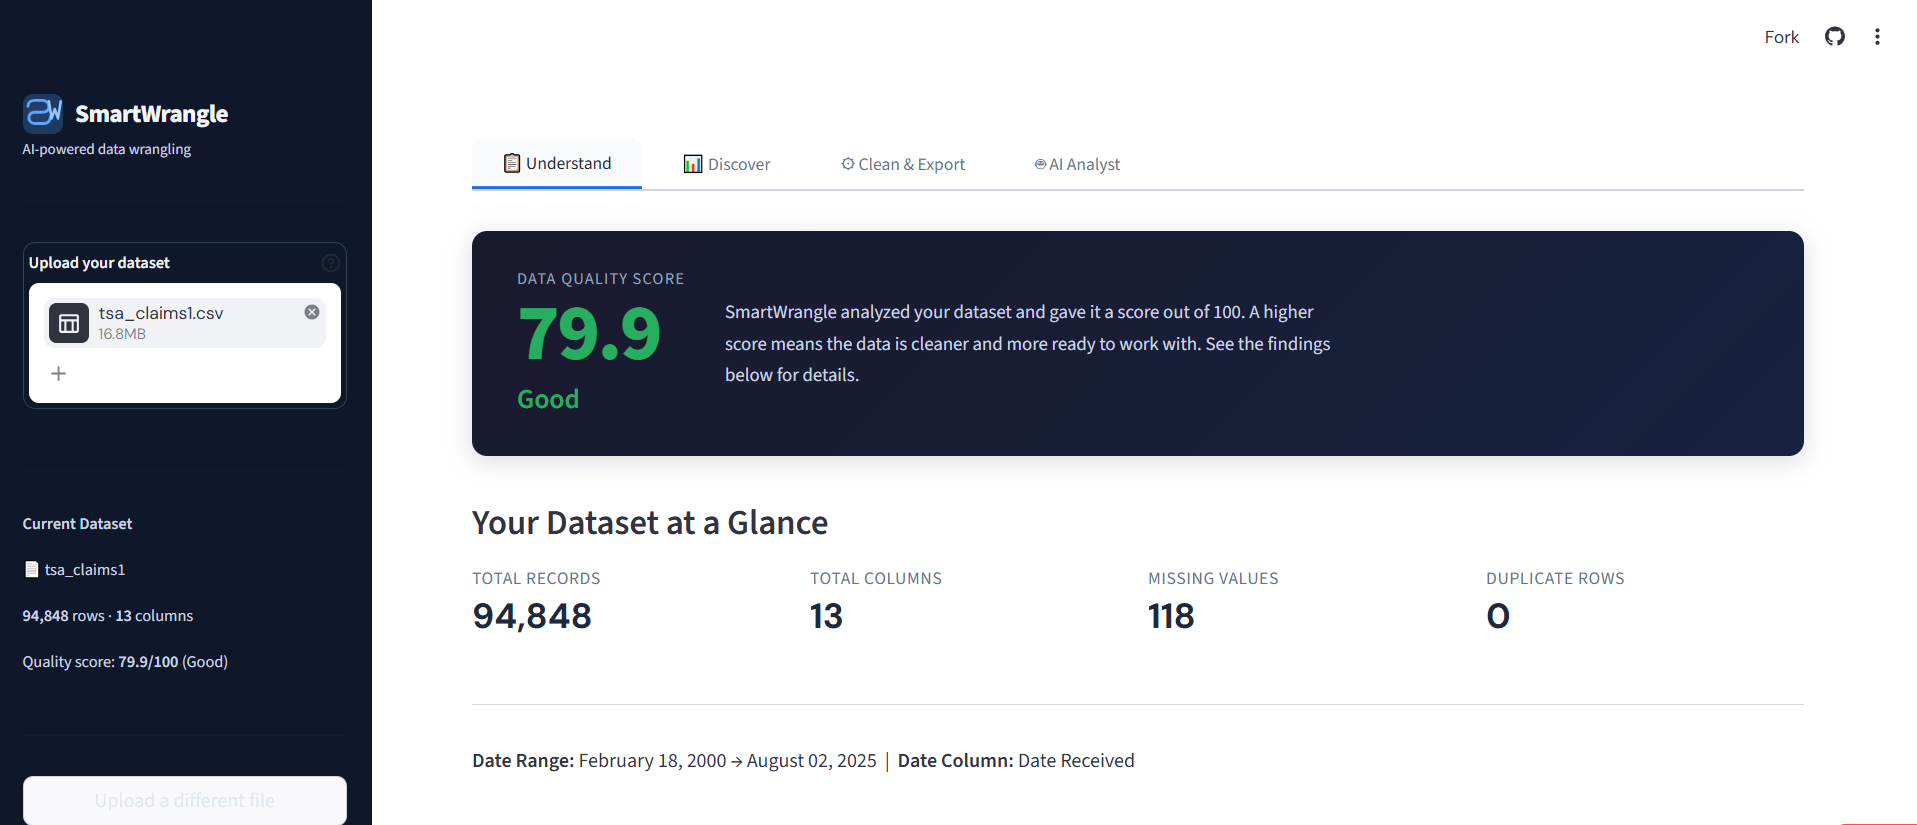
The Understand tab. SmartWrangle scores any uploaded dataset out of 100 and classifies every column in plain English.
The Problem
Most people who work with data aren't data scientists. They're teachers, coordinators, small business owners, analysts in their first year on the job. They open a spreadsheet, see a wall of numbers, and have no quick way to answer the most basic questions: What's actually in here? Is it clean? What does it mean?
I wanted a tool that would do for a non-technical person what a data scientist does in their head in the first ten minutes of looking at a new dataset, but without making them learn pandas, write code, or hire someone.
What I Built
SmartWrangle takes any CSV or Excel file and gives the user three things immediately:
- A plain-English explanation of what's in the data, including column types, date ranges, a 0 to 100 quality score, and any problems found.
- Auto-generated charts with AI-written headlines that tell the user what each visualization actually means.
- One-click cleaning tools with full undo support. Remove duplicates, fill missing values, fix formats, and download the cleaned dataset.
The Three Tabs
Understand scores the dataset and explains every finding in plain English. Discover auto-detects what kind of data is present and generates the most relevant charts. Clean & Export suggests fixes, previews them before applying, and lets the user undo anything.
Auto-Generated Charts with Plain-English Headlines
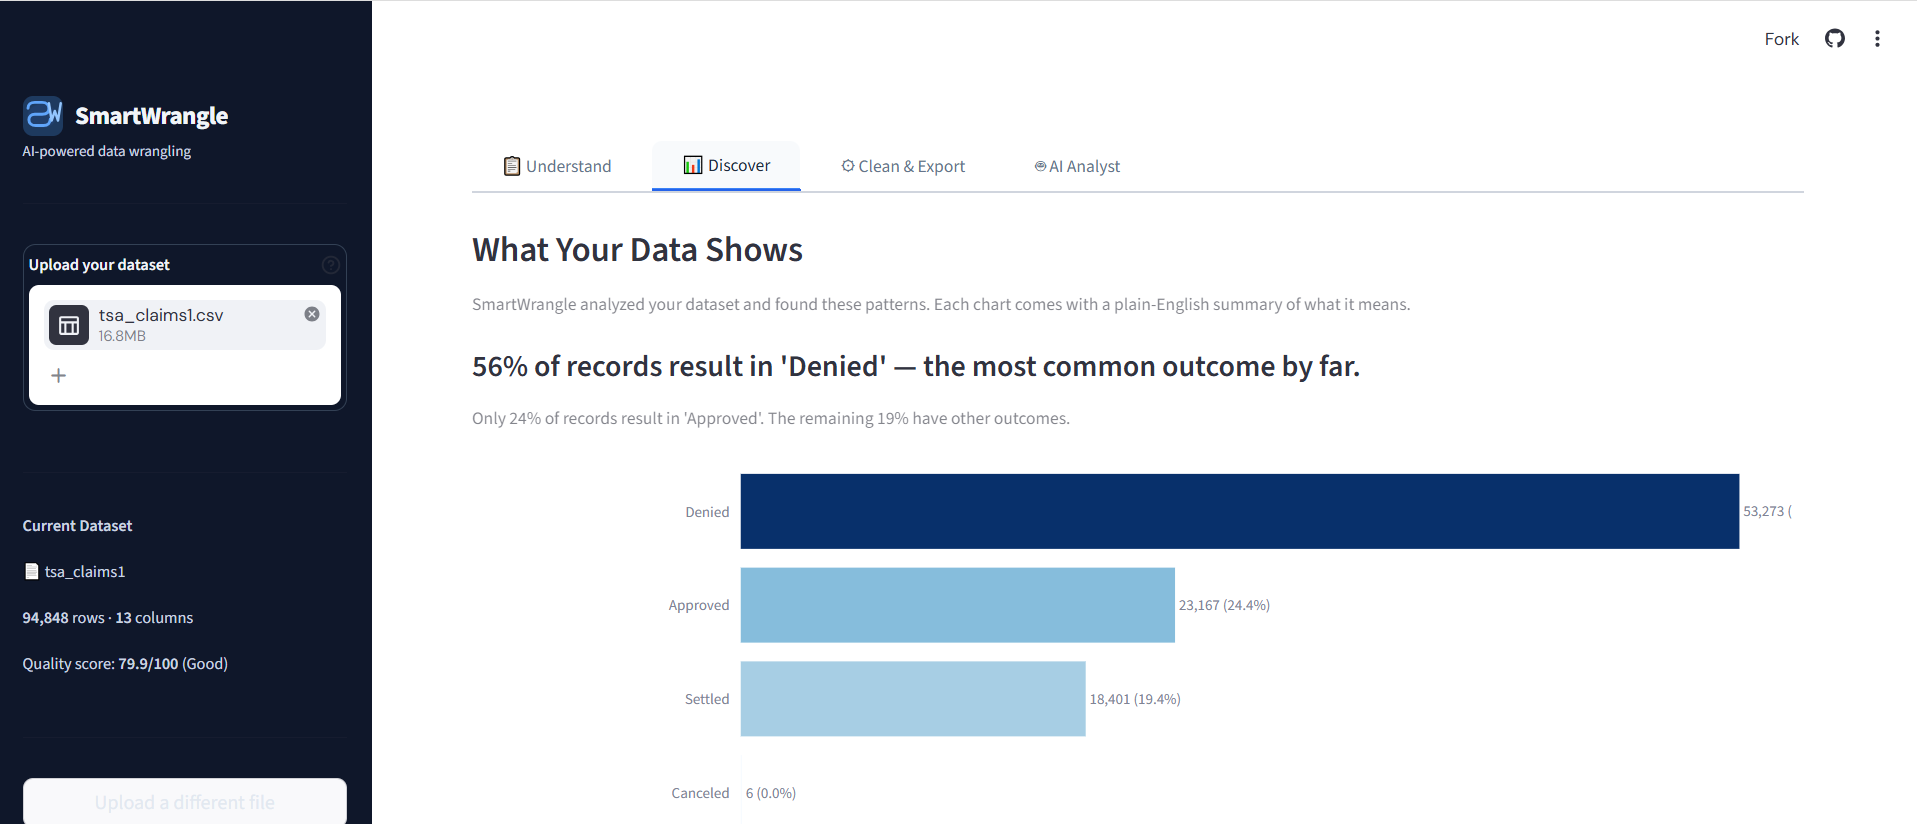
Charts come with AI-written headlines that tell the user what the data is showing, not just what's plotted.
How It's Built
SmartWrangle separates analysis logic from UI on purpose. The engine/ layer contains all transformation code with zero Streamlit dependencies. Every cleaning function returns a tuple of (new_df, log_message), a modified DataFrame and a plain-English description of what was done. The original uploaded file is never modified.
Session state persists the working dataset, undo history, cleaning log, column types, and quality score across reruns. Column types are refreshed after every cleaning action so suggestions stay accurate.
The app is general-purpose. There are no hardcoded column names anywhere. It works on any structured dataset by using pattern matching on column names and statistical properties to classify and analyze data.
One-Click Cleaning with Full Undo
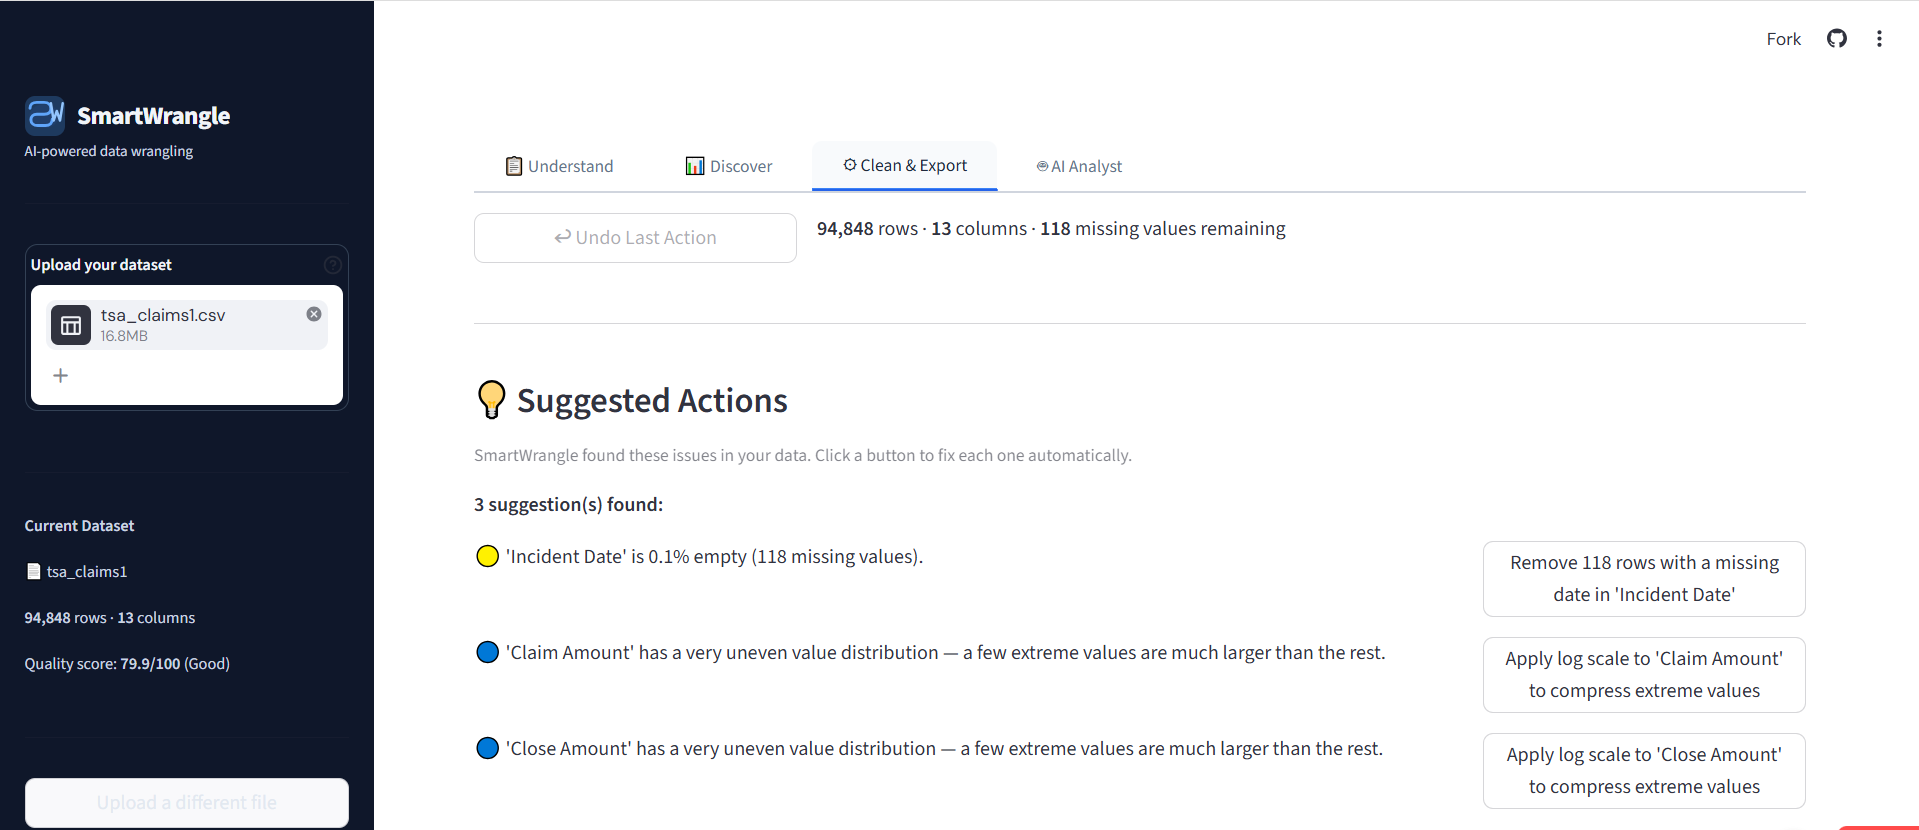
Suggested Actions surface the issues SmartWrangle found. Every action is reversible with the Undo button at the top.
Tech Stack
What I Learned
I picked Streamlit for SmartWrangle because it was the fastest way to get a working app in front of users. But I separated the project into folders from day one. The cleaning engine, the UI, and the utilities each live in their own layer and don't depend on each other. That was deliberate. If I want to swap Streamlit for Flask or React later, I can rebuild that one folder without touching the rest. If I want to improve a single cleaning function, I can do it without breaking the interface. The hard work, figuring out how to clean unfamiliar data without destroying it, doesn't get thrown away when the front end changes.
The undo system was the feature I almost cut and ended up depending on most. The point of cleaning data is to make it more useful, not less, and sometimes a cleaning step that looks like a fix actually destroys information you needed. Removing rows with missing values is the obvious example. It speeds up your analysis right up until you realize you just deleted half your dataset. Undo lets the user test a step, see what changed, and back out if the cleaned data looks worse than the original. It changed how I tested my own tool.
Building for "any dataset" instead of one specific dataset forced me to think about every cleaning step as a question, not an answer. A specific tool can hardcode what to do. Drop these columns, fill these nulls with the mean, convert this date format. A general tool has to read what's actually in front of it and decide. That's why SmartWrangle uses pattern matching on column names and statistical properties to classify data instead of assuming a schema. It's slower to build, but it works the next time someone uploads a file I've never seen.
Next Project